Living on Maui during COVID-19.

Well I would have to say at first it was a harsh blow with this Corona Virus. Now that we have all seen the real numbers, and we are not all going to die as chicken little stated in the being of the pandemic. We do need to see business getting back too normal as parts of the country are opening for business. So how does this effect real estate on Maui.

We had another good week of escrows with relatively few cancellations. We also heard from others across the industry that activity seems to be picking up. It’s probably a combination of buyers/sellers getting used to the new normal, and all of us seeing light at the end of the tunnel. As the recovery becomes more clear we are gearing up for a hopefully decent recovery pattern and some pent up demand we can service over the summer.

Here are the March statistics for real estate on Maui provided by Realtors Ass. Of Maui.
March 2020
As COVID-19’s impact spread across the country in March, the stock market declines started in February accelerated downward before recovering a bit in the last week of the month. With volatility across all the financial markets, lenders began tightening underwriting standards and some buyers found they no longer were approved for a loan. Massive layoffs also shook the economy with 3.28 million initial jobless claims filed in a single week—the highest in history more than four times over.
New Listings decreased 43.0 percent for Single Family homes but increased 8.8 percent for Condominium homes. Pending Sales decreased 42.0 percent for Single Family homes and 56.8 percent for Condominium homes. Inventory decreased 20.4 percent for Single Family homes and 7.6 percent for Condominium homes.
Median Sales Price increased 17.9 percent to $840,000 for Single Family homes and 9.1 percent to $555,000 for Condominium homes. Days on Market decreased 11.6 percent for Single Family homes but increased 28.0 percent for Condominium homes. Months Supply of Inventory decreased 21.7 percent for Single Family homes and 2.3 percent for Condominium homes.
While the effect of COVID-19 is varied throughout the country, we are likely to see impacts to housing activity now and into the coming months. Its continued spread is leading many companies and consumers to change their daily activities. ShowingTime is closely monitoring the situation and releasing daily updates on changes in showing activity. See national and state showing activity trends at https://www.showingtime.com/impact-of- coronavirus/.
Quick Facts
– 1.5%
Change in Number of
Closed Sales
All Properties
+ 8.3%
Change in Number of
Median Sales Price
All Properties
– 12.2%
Change in Number of
Homes for Sale
All Properties
This is a research tool provided by the REALTORS® Association of Maui, Inc. Percent changes are calculated using rounded figures.
So my best estimations is the condo market is going to be slow recovering until planes are flying with visitors returning to the Hawaiian island. The housing market remains strong with low inventory and prices holding. But I am expecting to see some great buys as sellers move ahead with plans to return to the mainland. At the same time, I believe we will see new buyers stepping up to the plate wanting to say Aloha to the mainland and plant new roots on Maui.
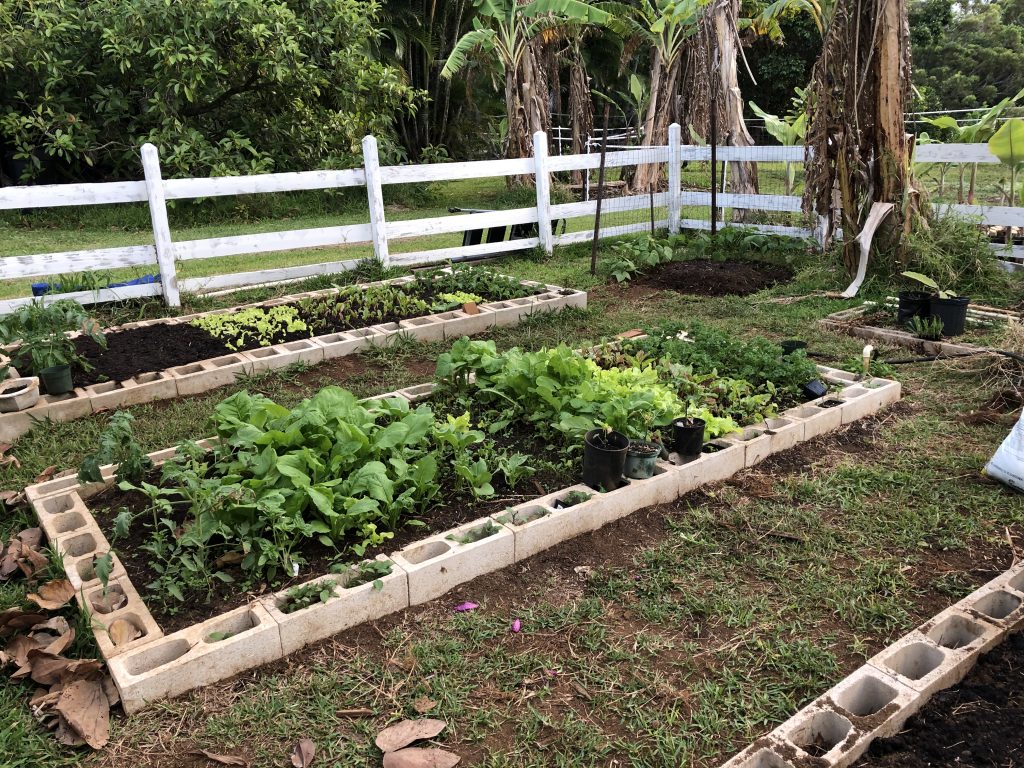
So what have I been doing on Maui since the lockdown? Other than working on real estate I planted an old garden. 26X26 beds which were full of weeds is now a flourishing garden. My daughter who did work at the Wailea Marriott has been off work. So she brought her two horses home on our 2-acre home-site. The horses have been providing me with fresh straw and compost.
I also have been dusting off our bikes, and my wife Ivy and I been biking on the Northshore and enjoying a swim on empty beaches. Little bit of surfing and windsurfing keeps you in good shape. It’s amazing without rent cars on the roads it’s pretty quiet. Paia town has been boarded up looking like a ghost town. But Maui people are ready to get back to work. Some stores are opening ready for business.
Below is a complete Maui market report for the month of April.
Steve Nickens
All Realtors Association of Maui Districts Combined
Published: May 2020*
Property Types: All Single Family Homes – All Properties – All Properties – All Properties – All Lot Sizes
Price Range: $0 – No Limit SQFT Range: 0 – No Limit
Bedrooms:0 – No Limit Bathrooms: 0 – No Limit
Year Built: 0 – No Limit
April 2020 is a Neutral market! The number of for sale listings was down 12.6% from one year earlier and up 0.2% from the previous month. The number of sold listings increased 9.1% year over year and decreased 6.7% month over month. The number of under contract listings was down 24.6% compared to previous month and down 58.2% compared to previous year. The Months of Inventory based on Closed Sales is 5, down 20.6% from the previous year.
The Average Sold Price per Square Footage was down 8.4% compared to previous month and up 5.5% compared to last year. The Median Sold Price decreased by 9.9% from last month. The Average Sold Price also decreased by 16.6% from last month. Based on the 6-month trend, the Average Sold Price trend is “Neutral” and the Median Sold Price trend is “Neutral”.
The Average Days on Market showed an upward trend, an increase of 36.5% compared to previous year. The ratio of Sold Price vs. Original List Price is 92%, was the same compared to previous year.
It is a Neutral Market
Property Sales (Sold)
April property sales were 84, up 9.1% from 77 in April of 2019 and 6.7%lower than the 90 sales last month.
Current Inventory (For Sale)
Versus last year, the total number of properties available this month is lower by 61 units of 12.6%. This year’s smaller inventory means that buyers who waited to buy may have smaller selection to choose from. The number of current inventory is up 0.2% compared to the previous month.
Property Under Contract (Pended)
There was a decrease of 24.6% in the pended properties in April, with 46 properties versus 61 last month. This month’s pended property sales were 58.2% lower than at this time last year.
All reports are published May 2020, based on data available at the end of April 2020, except for the today’s stats. All reports presented are based on data supplied by the HiCentral, RAMaui, and Hawaii Information Services MLS. Neither the Association nor its MLSs guarantee or is in anyway responsible for its accuracy. Data maintained by the Association or its MLS’s may not reflect all real estate activities in the market. Information deemed reliable but not guaranteed.
Steve Nickens
All Realtors Association of Maui Districts Combined
Published: May 2020*
Property Types: All Single Family Homes – All Properties – All Properties – All Properties – All Lot Sizes
Price Range: $0 – No Limit SQFT Range: 0 – No Limit
Bedrooms:0 – No Limit Bathrooms: 0 – No Limit
Year Built: 0 – No Limit
The Average Sold Price per Square Footage is Neutral*
The Average Sold Price per Square Footage is a great indicator for the direction of property values. Since Median Sold Price and Average Sold Price can be impacted by the ‘mix’ of high or low end properties in the market, the Average Sold Price per Square Footage is a more normalized indicator on the direction of property values. The April 2020 Average Sold Price per Square Footage of $521 was down 8.4% from $569 last month and up 5.5%from $494 in April of last year.
* Based on 6 month trend – Appreciating/Depreciating/Neutral
The Days on Market Shows Upward Trend*
The average Days on Market (DOM) shows how many days the average property is on the market before it sells. An upward trend in DOM trends to indicate a move towards more of a Buyer’s market, a downward trend indicates a move towards more of a Seller’s market. The DOM for April 2020 was 86, up 17.8% from 73 days last month and up 36.5% from 63 days in April of last year.
The Sold/Original List Price Ratio Remains Steady**
The Sold Price vs. Original List Price reveals the average amount that sellers are agreeing to come down from their original list price. The lower the ratio is below 100% the more of a Buyer’s market exists, a ratio at or above 100% indicates more of a Seller’s market. This month Sold Price vs. Original List Price of 92% is up 2.2% % from last month and the same as in April of last year.
* Based on 6 month trend – Upward/Downward/Neutral ** Based on 6 month trend – Rising/Falling/Remains Steady
All reports are published May 2020, based on data available at the end of April 2020, except for the today’s stats. All reports presented are based on data supplied by the HiCentral, RAMaui, and Hawaii Information Services MLS. Neither the Association nor its MLSs guarantee or is in anyway responsible for its accuracy. Data maintained by the Association or its MLS’s may not reflect all real estate activities in the market. Information deemed reliable but not guaranteed.
Steve Nickens
All Realtors Association of Maui Districts Combined
Published: May 2020*
Property Types: All Single Family Homes – All Properties – All Properties – All Properties – All Lot Sizes
Price Range: $0 – No Limit SQFT Range: 0 – No Limit
Bedrooms:0 – No Limit Bathrooms: 0 – No Limit
Year Built: 0 – No Limit
The Average For Sale Price is Depreciating* The Average For Sale Price in April was $2,436,000, down 12.1% from $2,771,000 in April of 2019 and down 6.4% from $2,603,000 last month.
The Average Sold Price is Neutral* The Average Sold Price in April was $1,007,000, down 6.2%from $1,073,000 in April of 2019 and down 16.6% from $1,208,000 last month.
The Median Sold Price is Neutral* The Median Sold Price in April was $755,000, down 5.5%from $799,000 in April of 2019 and down 9.9% from $838,000 last month.
* Based on 6 month trend – Appreciating/Depreciating/Neutral
It is a Neutral Market*
A comparatively lower Months of Inventory is more beneficial for sellers while a higher months of inventory is better for buyers.
*Buyer’s market: more than 6 months of inventory Seller’s market: less than 3 months of inventory Neutral market: 3 – 6 months of inventory
Months of Inventory based on Closed Sales
The April 2020 Months of Inventory based on Closed Sales of 5 was decreased by 20.6% compared to last year and up 6.4% compared to last month. April 2020 is Neutral market.
Months of Inventory based on Pended Sales
The April 2020 Months of Inventory based on Pended Sales of 9.2 was increased by 108.9% compared to last year and up 33.2% compared to last month. April 2020 is Buyer’s market.
All reports are published May 2020, based on data available at the end of April 2020, except for the today’s stats. All reports presented are based on data supplied by the HiCentral, RAMaui, and Hawaii Information Services MLS. Neither the Association nor its MLSs guarantee or is in anyway responsible for its accuracy. Data maintained by the Association or its MLS’s may not reflect all real estate activities in the market. Information deemed reliable but not guaranteed.
Steve Nickens
All Realtors Association of Maui Districts Combined
Published: May 2020*
Property Types: All Single Family Homes – All Properties – All Properties – All Properties – All Lot Sizes
Price Range: $0 – No Limit SQFT Range: 0 – No Limit
Bedrooms:0 – No Limit Bathrooms: 0 – No Limit
Year Built: 0 – No Limit
It is a Neutral Market*
Absorption Rate measures the inverse of Months of Inventory and represents how much of the current active listings (as a percentage) are being absorbed each month.
*Buyer’s market: 16.67% and below Seller’s market: 33.33% and above Neutral market: 16.67% – 33.33%
Absorption Rate based on Closed Sales
The April 2020 Absorption Rate based on Closed Sales of 19.8 was increased by 24.6% compared to last year and down 7% compared to last month.
Absorption Rate based on Pended Sales
The April 2020 Absorption Rate based on Pended Sales of 10.8 was decreased by 52.5% compared to last year and down 25% compared to last month.
All reports are published May 2020, based on data available at the end of April 2020, except for the today’s stats. All reports presented are based on data supplied by the HiCentral, RAMaui, and Hawaii Information Services MLS. Neither the Association nor its MLSs guarantee or is in anyway responsible for its accuracy. Data maintained by the Association or its MLS’s may not reflect all real estate activities in the market. Information deemed reliable but not guaranteed.


I hope that your Ohana is safe and in good health. No doubt we have been experiencing unprecedented times and challenged during the pass months. We are adjusting how we are doing business, we will be respecting Maui county guide lines with the showing of properties. Implementing 3D tours of homes and condos, virtual Brokers open houses, virtual meeting with Zoom, and electronic signatures and mobile notaries. Moving forward there is still a real estate market, please let us know if you have any questions about Maui real estate sales.
Aloha Steve,


Steven Nickens RS-54097 GRI ABR SFR
Windermere/Wailea Realty Corp
Offices in Shops at Wailea and Kihei
Serving all Maui
Cell: 808-280-2208
Email: nickensmaui@gmail.com
Leave a Reply